> ## Documentation Index
> Fetch the complete documentation index at: https://www.revve.ai/docs/llms.txt
> Use this file to discover all available pages before exploring further.
# Analytics Dashboard
> Four dashboards for operators and team leads: an auto-refreshing Overview, Chat Agents website engagement, AI Agents containment and quality, and Human Agents team performance.
The **Analytics** section in the left sidebar contains four dashboards. Each answers a different question:
| Page | Question it answers |
| ---------------- | ----------------------------------------------------------------------------------- |
| **Overview** | What is happening right now, and how does today compare to yesterday? |
| **Chat Agents** | How well are my website chat agents engaging visitors and converting them to leads? |
| **AI Agents** | How much work is AI resolving on its own, and is the quality holding up? |
| **Human Agents** | How fast and how well is my human team responding? |
Access requires the **Manage Analytics** permission, which only admins have by default. See [Roles and Permissions](/docs/governance-access/roles-and-permissions) if the section is missing from your sidebar.
## Overview
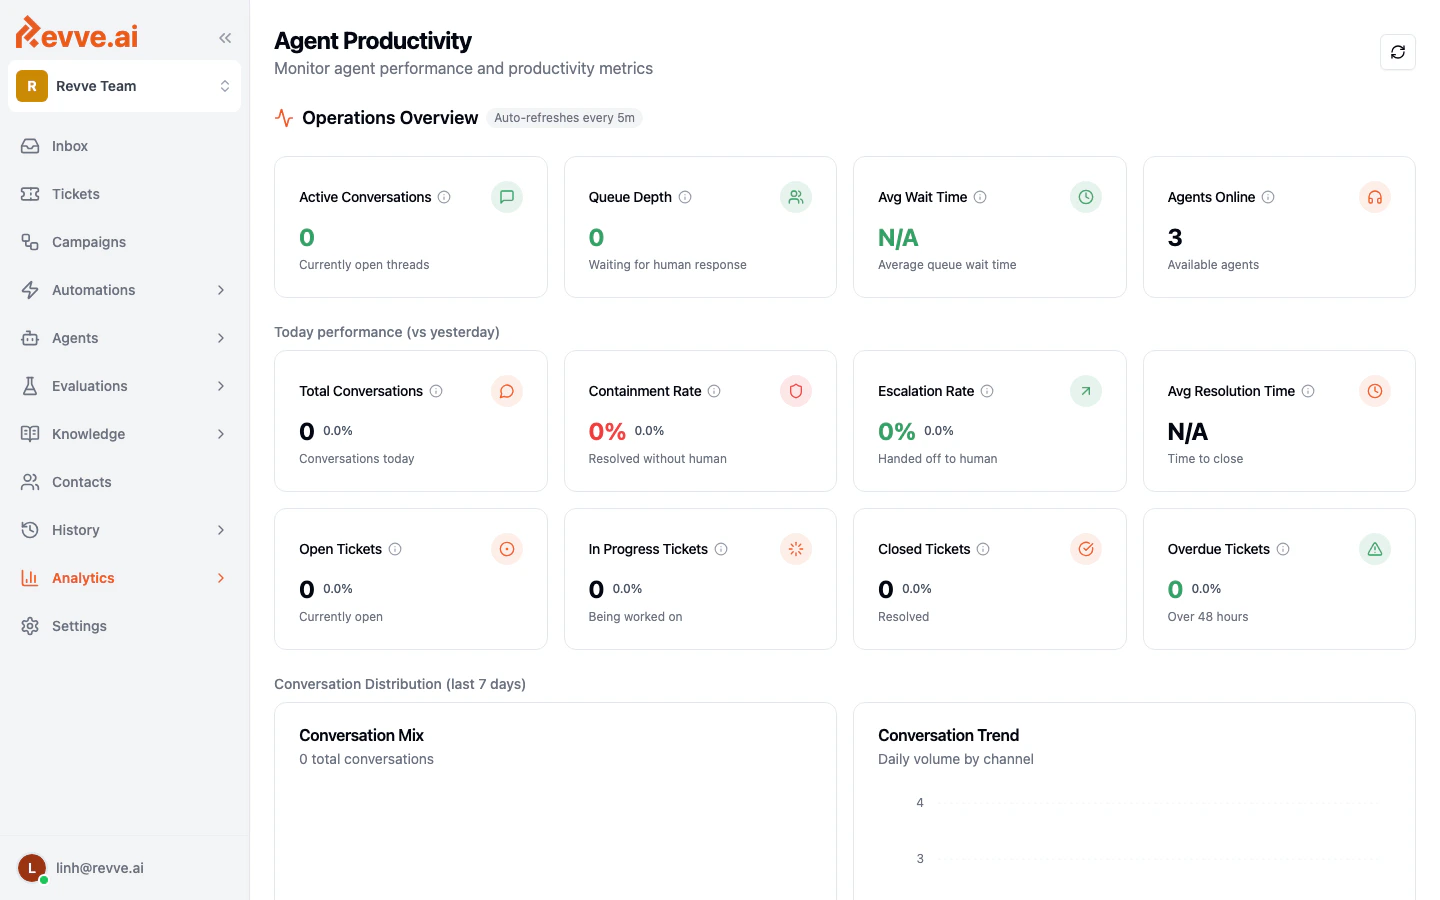
The Overview page (titled **Agent Productivity**) gives you a live snapshot of your operations. It is the only dashboard that auto-refreshes — the **Operations Overview** section carries an "Auto-refreshes every 5m" pill — and you can click **Refresh** for the latest data at any time.
 ### Real-Time Status
Four cards show your current operational state:
| Metric | Description |
| ------------------------ | ---------------------------------------------------------- |
| **Active Conversations** | The number of conversation threads currently open. |
| **Queue Depth** | How many conversations are waiting for a human response. |
| **Avg Wait Time** | The average time visitors spend waiting in the queue. |
| **Agents Online** | The number of team members currently available to respond. |
### Today's Performance (vs Yesterday)
Summary cards compare today's numbers to yesterday, each with the current value and the percentage change:
| Metric | Description |
| ----------------------- | ---------------------------------------------------------------- |
| **Total Conversations** | All conversations started today. |
| **Containment Rate** | Percentage of conversations resolved without human intervention. |
| **Escalation Rate** | Percentage of conversations handed off to a human agent. |
| **Avg Resolution Time** | Average time from conversation start to close. |
| **Open Tickets** | Currently open support tickets. |
| **In Progress Tickets** | Tickets being actively worked on. |
| **Closed Tickets** | Tickets resolved today. |
| **Overdue Tickets** | Tickets that have been open for more than 48 hours. |
### Distribution charts (Last 7 Days)
Below the cards, three groups of charts break down the past week:
* **Conversation distribution** — a pie chart of conversation volume by channel (Website, SMS, WhatsApp, Messenger, Email, Zalo, Zalo OA) and a line chart of daily volume per channel.
* **Ticket distribution** — daily tickets by status (Open, In Progress, Closed) and daily ticket volume by channel.
* **Escalation trends** — escalations per day, and a breakdown of which channels generate the most escalations.
Check the Overview at the start of each shift. Queue Depth and Agents Online together tell you immediately whether you are staffed for the current load — before any customer feels the wait.
## Chat Agents
The **Chat Agents** page measures engagement and conversion for **website** chat agents — how many visitors see your pages, how many start a chat, and how many become leads. It covers website agents only; if you have none, the page prompts you to create one.
### Real-Time Status
Four cards show your current operational state:
| Metric | Description |
| ------------------------ | ---------------------------------------------------------- |
| **Active Conversations** | The number of conversation threads currently open. |
| **Queue Depth** | How many conversations are waiting for a human response. |
| **Avg Wait Time** | The average time visitors spend waiting in the queue. |
| **Agents Online** | The number of team members currently available to respond. |
### Today's Performance (vs Yesterday)
Summary cards compare today's numbers to yesterday, each with the current value and the percentage change:
| Metric | Description |
| ----------------------- | ---------------------------------------------------------------- |
| **Total Conversations** | All conversations started today. |
| **Containment Rate** | Percentage of conversations resolved without human intervention. |
| **Escalation Rate** | Percentage of conversations handed off to a human agent. |
| **Avg Resolution Time** | Average time from conversation start to close. |
| **Open Tickets** | Currently open support tickets. |
| **In Progress Tickets** | Tickets being actively worked on. |
| **Closed Tickets** | Tickets resolved today. |
| **Overdue Tickets** | Tickets that have been open for more than 48 hours. |
### Distribution charts (Last 7 Days)
Below the cards, three groups of charts break down the past week:
* **Conversation distribution** — a pie chart of conversation volume by channel (Website, SMS, WhatsApp, Messenger, Email, Zalo, Zalo OA) and a line chart of daily volume per channel.
* **Ticket distribution** — daily tickets by status (Open, In Progress, Closed) and daily ticket volume by channel.
* **Escalation trends** — escalations per day, and a breakdown of which channels generate the most escalations.
Check the Overview at the start of each shift. Queue Depth and Agents Online together tell you immediately whether you are staffed for the current load — before any customer feels the wait.
## Chat Agents
The **Chat Agents** page measures engagement and conversion for **website** chat agents — how many visitors see your pages, how many start a chat, and how many become leads. It covers website agents only; if you have none, the page prompts you to create one.
 ### Controls
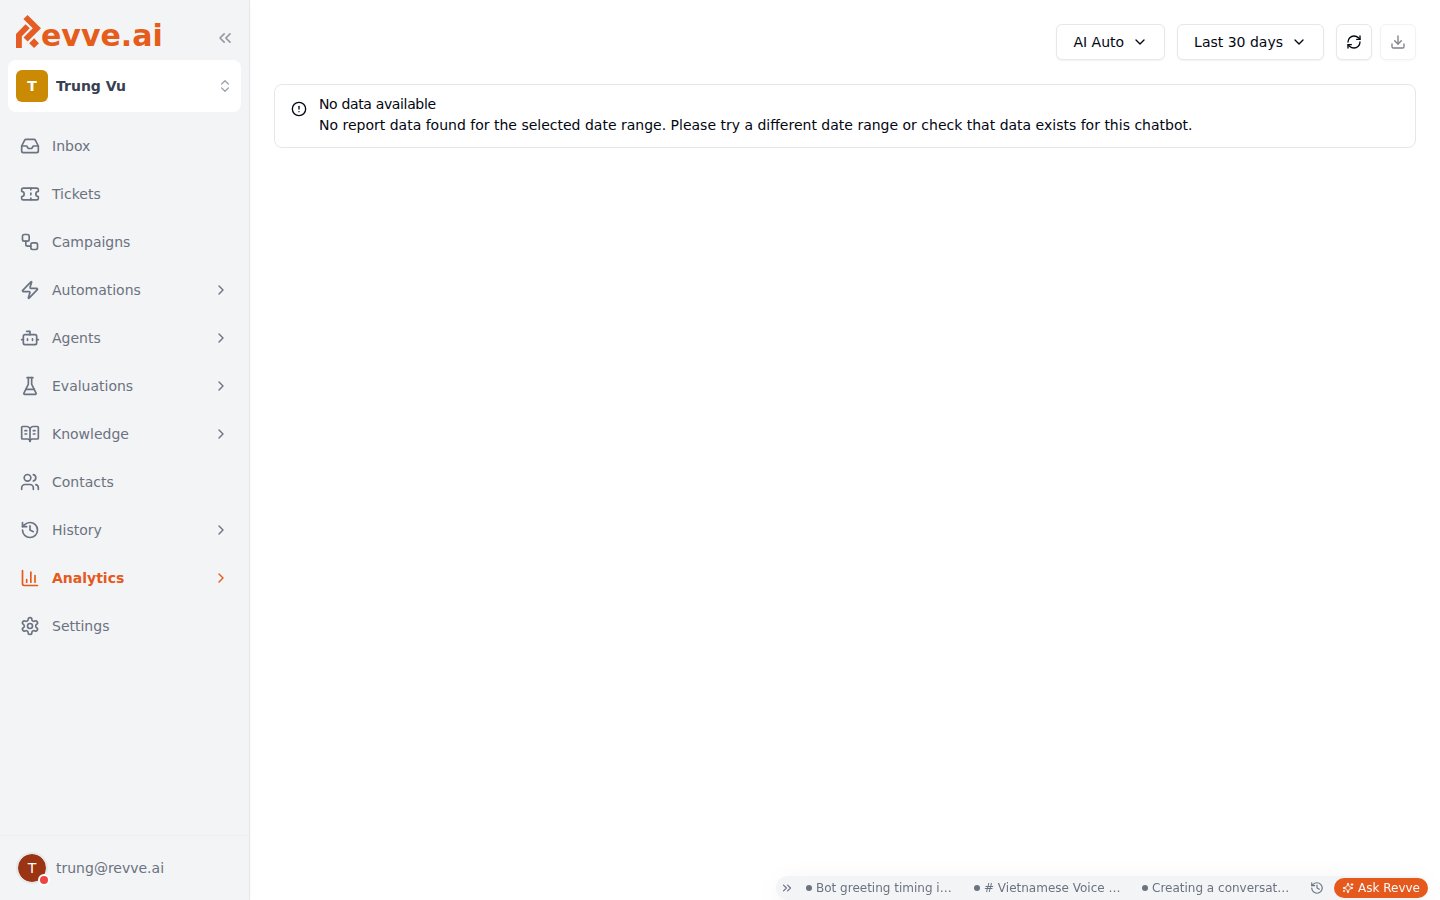
| Control | Behavior |
| -------------------- | --------------------------------------------------------------------------------------------- |
| **Chatbot selector** | Choose which website chat agent to analyze (website bots only). |
| **Time period** | **Last 7 / 14 / 30 days** (default **Last 30 days**), or **Custom range** with a date picker. |
| **Refresh** | Reloads the data. This dashboard does not auto-refresh; data is pre-aggregated daily. |
| **Export CSV** | Downloads the underlying data — this is the only Analytics dashboard with CSV export. |
### Summary cards
Four cards, each showing a trend against the prior period of equal length:
| Metric | What it measures |
| -------------------- | ---------------------------------------------------------------------------------- |
| **Total Page Views** | Views of pages where the widget is installed, with "Avg N per day". |
| **Chats** | Conversations started, shown as a percentage of page views — your chat conversion. |
| **Leads** | Leads captured, shown as a percentage conversion rate — leads per chat. |
| **Resolution Rate** | Successful resolutions per chat. |
Read the two conversion percentages as a funnel: page views → chats → leads. If page views are healthy but chats are low, your widget or conversation starters need work; if chats are high but leads are low, the agent isn't collecting contact details effectively.
### Engagement and conversion charts
* **Engagement chart** — Page Views as a toggleable line, Chats as a line, and Leads as bars, over time.
* **Conversion Performance** — chat conversion % and lead conversion % over time, with averages.
* **Why People Chat** — a donut of the top contact reasons.
* **How Chats Begin** — Manual (visitor typed) vs Preset (clicked a conversation starter).
* **Conversation Starter Distribution** — which preset buttons get used most. Retire starters nobody clicks and promote the ones that convert.
* **Top Chat URLs** — the 10 pages generating the most chats, with its own **Export CSV**.
* **URL Categories** — chats by website section (top 5, plus Other).
### Exports
Two CSVs are available: a daily report (Date, Page Views, Chats, Leads, Meetings, Successful Resolutions, Chat Conversion, Lead Conversion, Resolution Rate) and a URL data file (URL, Chat Count). Use the daily report to build your own week-over-week comparisons, or subscribe to [Daily Reports](/docs/history-analytics/daily-reports) for a scheduled summary instead.
## AI Agents
The **AI Agents** page (titled **AI Agent Performance**) monitors AI effectiveness, response performance, and escalation patterns. Use the **date range selector** to choose a period (defaults to the last 7 days). Refresh is manual; there is no export.
### Controls
| Control | Behavior |
| -------------------- | --------------------------------------------------------------------------------------------- |
| **Chatbot selector** | Choose which website chat agent to analyze (website bots only). |
| **Time period** | **Last 7 / 14 / 30 days** (default **Last 30 days**), or **Custom range** with a date picker. |
| **Refresh** | Reloads the data. This dashboard does not auto-refresh; data is pre-aggregated daily. |
| **Export CSV** | Downloads the underlying data — this is the only Analytics dashboard with CSV export. |
### Summary cards
Four cards, each showing a trend against the prior period of equal length:
| Metric | What it measures |
| -------------------- | ---------------------------------------------------------------------------------- |
| **Total Page Views** | Views of pages where the widget is installed, with "Avg N per day". |
| **Chats** | Conversations started, shown as a percentage of page views — your chat conversion. |
| **Leads** | Leads captured, shown as a percentage conversion rate — leads per chat. |
| **Resolution Rate** | Successful resolutions per chat. |
Read the two conversion percentages as a funnel: page views → chats → leads. If page views are healthy but chats are low, your widget or conversation starters need work; if chats are high but leads are low, the agent isn't collecting contact details effectively.
### Engagement and conversion charts
* **Engagement chart** — Page Views as a toggleable line, Chats as a line, and Leads as bars, over time.
* **Conversion Performance** — chat conversion % and lead conversion % over time, with averages.
* **Why People Chat** — a donut of the top contact reasons.
* **How Chats Begin** — Manual (visitor typed) vs Preset (clicked a conversation starter).
* **Conversation Starter Distribution** — which preset buttons get used most. Retire starters nobody clicks and promote the ones that convert.
* **Top Chat URLs** — the 10 pages generating the most chats, with its own **Export CSV**.
* **URL Categories** — chats by website section (top 5, plus Other).
### Exports
Two CSVs are available: a daily report (Date, Page Views, Chats, Leads, Meetings, Successful Resolutions, Chat Conversion, Lead Conversion, Resolution Rate) and a URL data file (URL, Chat Count). Use the daily report to build your own week-over-week comparisons, or subscribe to [Daily Reports](/docs/history-analytics/daily-reports) for a scheduled summary instead.
## AI Agents
The **AI Agents** page (titled **AI Agent Performance**) monitors AI effectiveness, response performance, and escalation patterns. Use the **date range selector** to choose a period (defaults to the last 7 days). Refresh is manual; there is no export.
 ### KPI cards
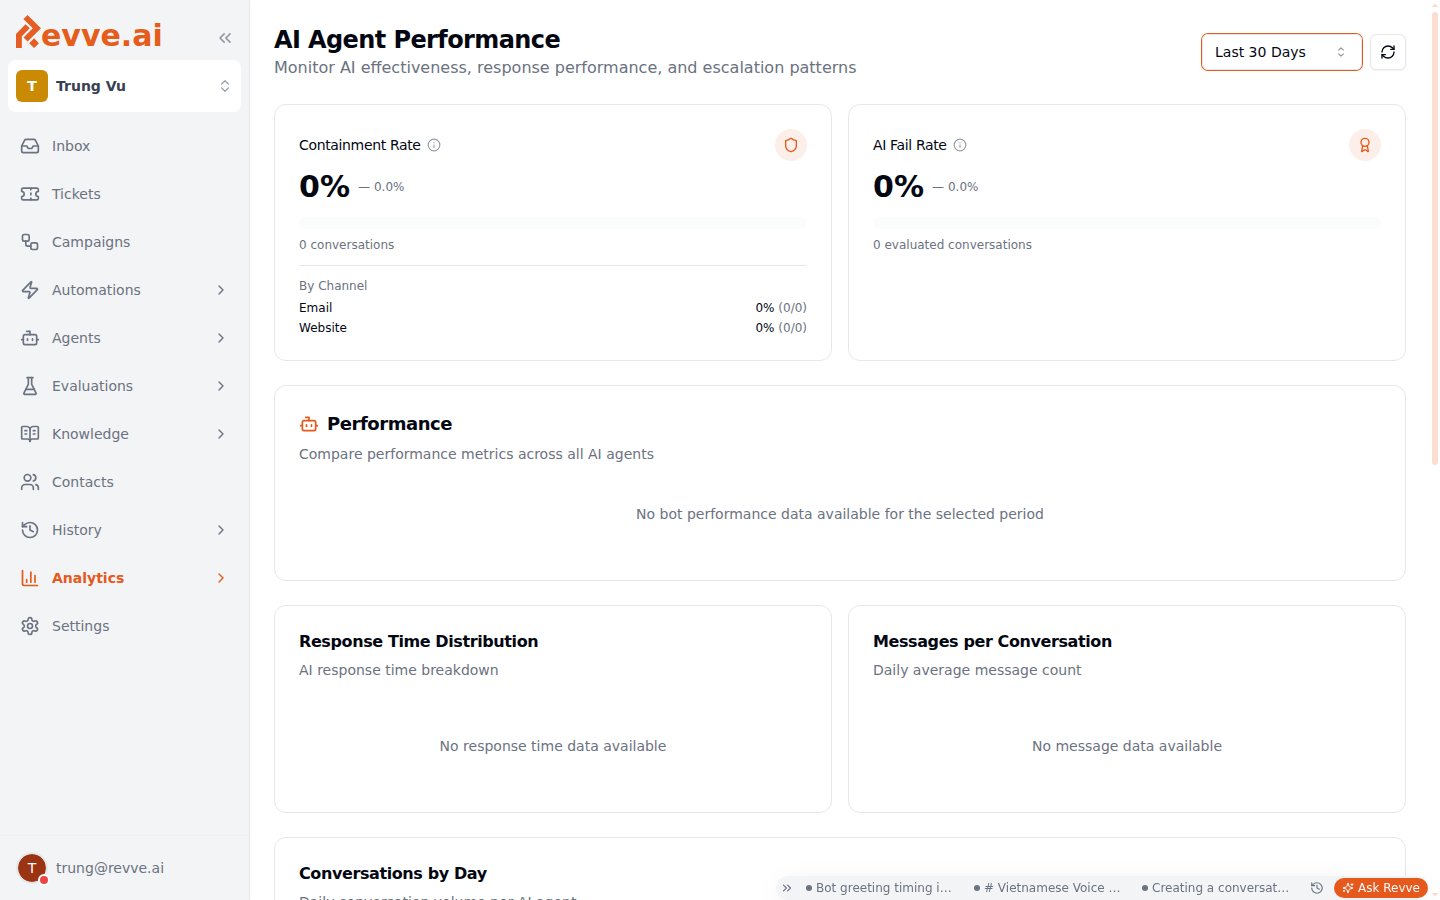
Two cards summarize AI performance:
| Metric | What it measures |
| -------------------- | --------------------------------------------------------------------------------------------------------------- |
| **Containment Rate** | Conversations resolved by AI without human handoff, with a per-channel breakdown. |
| **AI Fail Rate** | Percentage of AI-evaluated conversations that failed quality checks, and how many conversations were evaluated. |
The two come from different systems: Containment Rate, volume, and response times come from conversation analysis, while AI Fail Rate is produced by the evaluation system — see [Evaluations Overview](/docs/evaluations/evaluations-overview) for how conversations get scored.
Read the two cards together. High containment with a high fail rate means the AI is closing conversations it shouldn't — customers aren't escalating, but they aren't getting good answers either. Aim for containment rising while fail rate holds or falls.
### Agent Performance table
A sortable per-agent table with these columns:
| Column | Meaning |
| ----------------- | ------------------------------------------------------- |
| **Agent** | The chat agent. |
| **Volume** | Conversations handled in the period. |
| **Containment %** | Resolved by AI without human handoff. |
| **Fail %** | AI evaluation fail rate. |
| **Avg Response** | Average AI response time (shown as seconds or minutes). |
Sort by **Fail %** to find the agent that most needs prompt or knowledge base work; sort by **Volume** to see where a fix pays off fastest.
### Response and escalation charts
* **Response time histogram** — the distribution of AI response times, with the average.
* **Messages per conversation** — how long a typical AI conversation runs, with the average.
* **Conversations by day** — daily volume broken down per agent.
* **Conversation heatmap** — conversation volume by date and hour of day. Use it to see when visitors are most active.
* **Escalation heatmap** — when handoffs to humans happen, by time of day.
If containment starts falling, check the **escalation heatmap** first: escalations concentrated in specific hours usually point to a traffic pattern (a topic your agent can't handle that spikes at certain times, or after-hours questions it defers) rather than a general quality regression. Escalations spread evenly across days point back to the agent itself — review recent prompt or knowledge base changes. For what happens after a handoff, see [Human Takeover](/docs/inbox/human-takeover).
## Human Agents
The **Human Agents** page (titled **Human Agent Performance**) tracks team productivity, workload distribution, and response times. Use the **date range selector** to choose a period (defaults to the last 7 days). Refresh is manual; there is no export.
### KPI cards
Two cards summarize AI performance:
| Metric | What it measures |
| -------------------- | --------------------------------------------------------------------------------------------------------------- |
| **Containment Rate** | Conversations resolved by AI without human handoff, with a per-channel breakdown. |
| **AI Fail Rate** | Percentage of AI-evaluated conversations that failed quality checks, and how many conversations were evaluated. |
The two come from different systems: Containment Rate, volume, and response times come from conversation analysis, while AI Fail Rate is produced by the evaluation system — see [Evaluations Overview](/docs/evaluations/evaluations-overview) for how conversations get scored.
Read the two cards together. High containment with a high fail rate means the AI is closing conversations it shouldn't — customers aren't escalating, but they aren't getting good answers either. Aim for containment rising while fail rate holds or falls.
### Agent Performance table
A sortable per-agent table with these columns:
| Column | Meaning |
| ----------------- | ------------------------------------------------------- |
| **Agent** | The chat agent. |
| **Volume** | Conversations handled in the period. |
| **Containment %** | Resolved by AI without human handoff. |
| **Fail %** | AI evaluation fail rate. |
| **Avg Response** | Average AI response time (shown as seconds or minutes). |
Sort by **Fail %** to find the agent that most needs prompt or knowledge base work; sort by **Volume** to see where a fix pays off fastest.
### Response and escalation charts
* **Response time histogram** — the distribution of AI response times, with the average.
* **Messages per conversation** — how long a typical AI conversation runs, with the average.
* **Conversations by day** — daily volume broken down per agent.
* **Conversation heatmap** — conversation volume by date and hour of day. Use it to see when visitors are most active.
* **Escalation heatmap** — when handoffs to humans happen, by time of day.
If containment starts falling, check the **escalation heatmap** first: escalations concentrated in specific hours usually point to a traffic pattern (a topic your agent can't handle that spikes at certain times, or after-hours questions it defers) rather than a general quality regression. Escalations spread evenly across days point back to the agent itself — review recent prompt or knowledge base changes. For what happens after a handoff, see [Human Takeover](/docs/inbox/human-takeover).
## Human Agents
The **Human Agents** page (titled **Human Agent Performance**) tracks team productivity, workload distribution, and response times. Use the **date range selector** to choose a period (defaults to the last 7 days). Refresh is manual; there is no export.
 ### Team summary cards
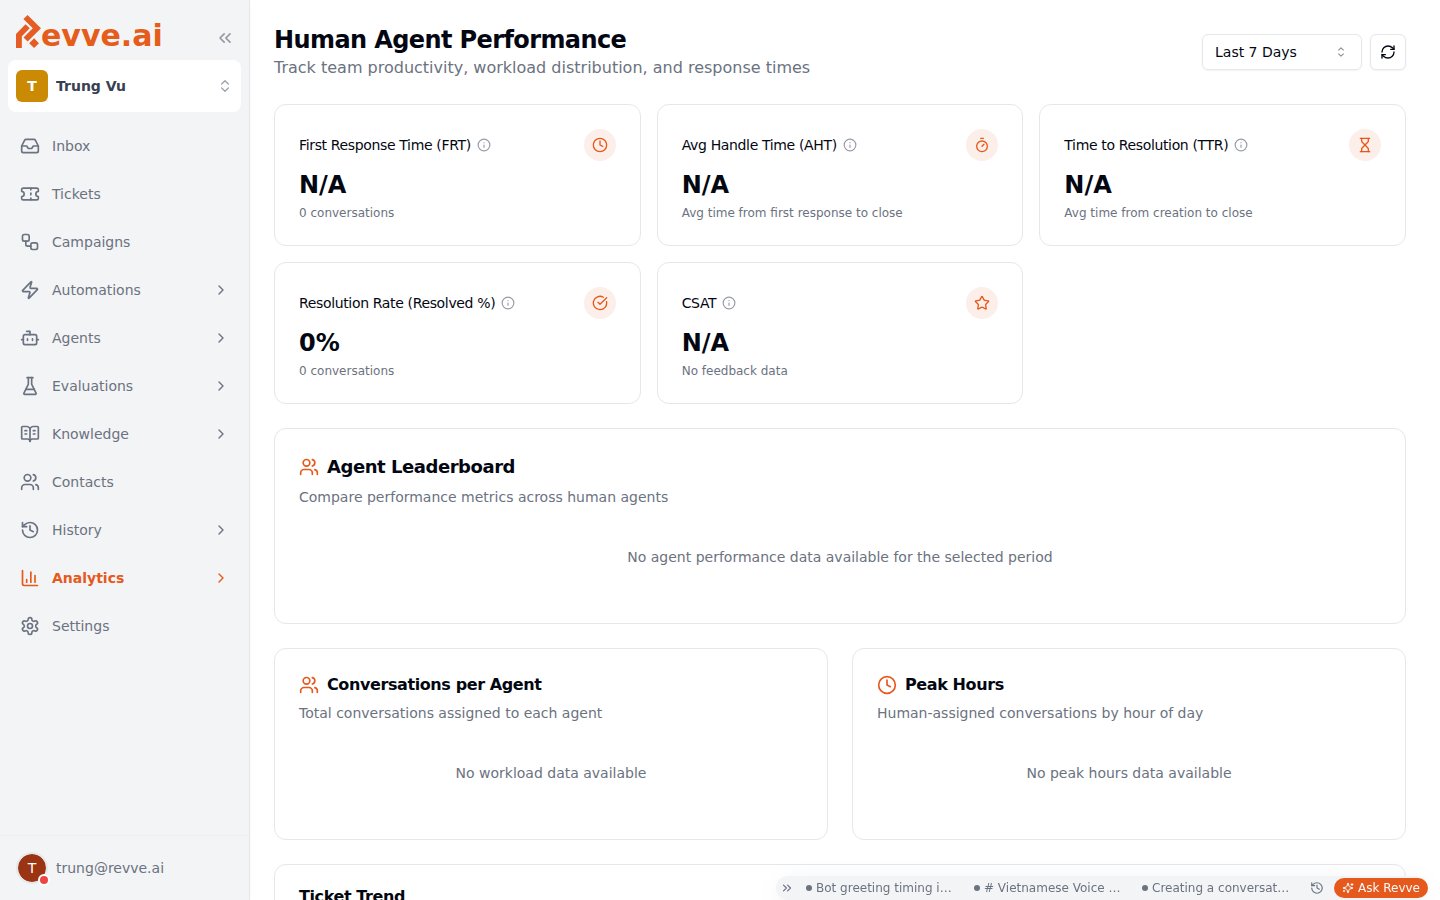
Five cards summarize the team:
| Metric | What it measures |
| -------------------------------- | ----------------------------------------------------- |
| **First Response Time (FRT)** | How long customers wait for the first human reply. |
| **Avg Handle Time (AHT)** | How long an agent actively works a conversation. |
| **Time to Resolution (TTR)** | Total time from handoff to resolved. |
| **Resolution Rate (Resolved %)** | Share of handled conversations that reach resolution. |
| **CSAT** | Customer satisfaction rating, on a 1–5 scale. |
CSAT comes from conversation feedback ratings — customers must be asked to rate. Enable feedback in the **Feedback** section of [Chat Agent Advanced Settings](/docs/general-configuration/chat-agent-advanced-settings), or this card stays empty.
### Agent leaderboard
A sortable per-agent table: **Agent**, **Active** (open conversations), **Total** (conversations), **Tickets Assigned**, **Tickets Resolved**, **FRT**, **Handle Time**, **Resolution Time**, **Resolution %**, **CSAT**.
Use it to compare like with like: an agent with a slow FRT but the highest ticket load isn't underperforming — they're overloaded. Ticket columns reflect the workflows described in [Working with Tickets](/docs/tickets/working-with-tickets).
### Workload and response charts
* **Workload distribution** — conversations per agent and peak hours.
* **Ticket trend** — ticket creation and resolution over the period.
* **Response time analysis** — human response times, including first response time by hour.
If FRT is rising, check the **workload distribution** chart before blaming individuals: a lopsided distribution means routing is funneling too much to too few people. Review your routing rules and per-agent concurrency caps in [Conversation Routing](/docs/administration/conversation-routing), then confirm with **first response time by hour** whether the slowdown tracks specific shifts.
## What's Next
* [Daily Reports](/docs/history-analytics/daily-reports) — get a scheduled summary of these metrics delivered instead of checking dashboards.
* [Evaluations Overview](/docs/evaluations/evaluations-overview) — how the quality checks behind AI Fail Rate work, and how to tune them.
### Team summary cards
Five cards summarize the team:
| Metric | What it measures |
| -------------------------------- | ----------------------------------------------------- |
| **First Response Time (FRT)** | How long customers wait for the first human reply. |
| **Avg Handle Time (AHT)** | How long an agent actively works a conversation. |
| **Time to Resolution (TTR)** | Total time from handoff to resolved. |
| **Resolution Rate (Resolved %)** | Share of handled conversations that reach resolution. |
| **CSAT** | Customer satisfaction rating, on a 1–5 scale. |
CSAT comes from conversation feedback ratings — customers must be asked to rate. Enable feedback in the **Feedback** section of [Chat Agent Advanced Settings](/docs/general-configuration/chat-agent-advanced-settings), or this card stays empty.
### Agent leaderboard
A sortable per-agent table: **Agent**, **Active** (open conversations), **Total** (conversations), **Tickets Assigned**, **Tickets Resolved**, **FRT**, **Handle Time**, **Resolution Time**, **Resolution %**, **CSAT**.
Use it to compare like with like: an agent with a slow FRT but the highest ticket load isn't underperforming — they're overloaded. Ticket columns reflect the workflows described in [Working with Tickets](/docs/tickets/working-with-tickets).
### Workload and response charts
* **Workload distribution** — conversations per agent and peak hours.
* **Ticket trend** — ticket creation and resolution over the period.
* **Response time analysis** — human response times, including first response time by hour.
If FRT is rising, check the **workload distribution** chart before blaming individuals: a lopsided distribution means routing is funneling too much to too few people. Review your routing rules and per-agent concurrency caps in [Conversation Routing](/docs/administration/conversation-routing), then confirm with **first response time by hour** whether the slowdown tracks specific shifts.
## What's Next
* [Daily Reports](/docs/history-analytics/daily-reports) — get a scheduled summary of these metrics delivered instead of checking dashboards.
* [Evaluations Overview](/docs/evaluations/evaluations-overview) — how the quality checks behind AI Fail Rate work, and how to tune them.